Water Balance
2023 | Buro Happold
Reducing water demand, and even achieving net-zero water, is an essential aspect of any project that aims to be sustainable in the AEC industry today. These Sankey charts help to show the complex flows between supply, consumption, and reuse of water in order to help engineers and clients understand how a given design performs. I developed a custom Grasshopper script to produce these Sankey charts, which are used for a wide variety of Sustainability and Advisory projects at Buro Happold.
Video of Grasshopper script in action
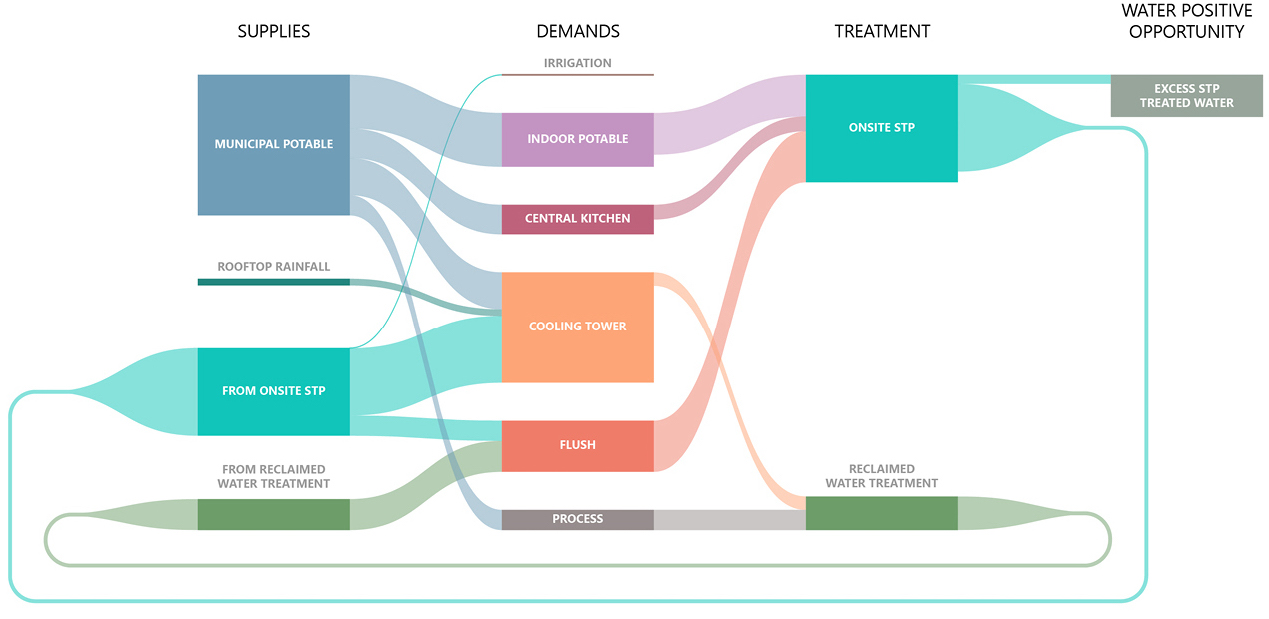
Sankey chart example
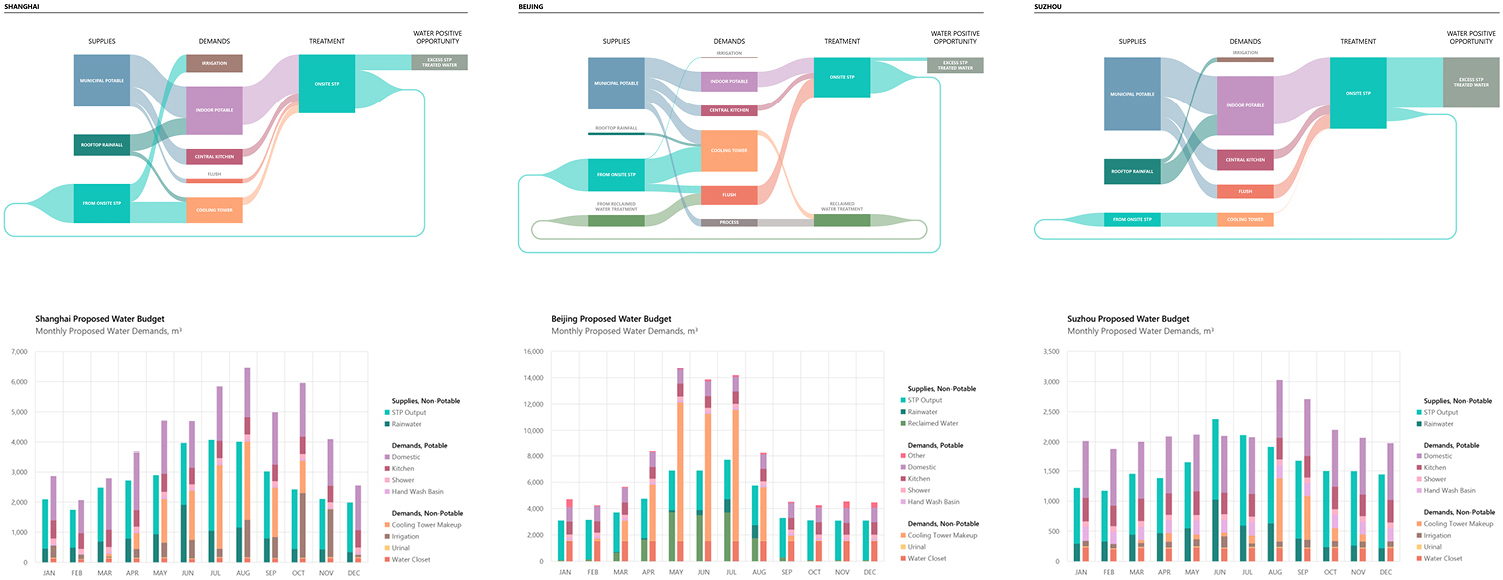
Two ways of showing the same data
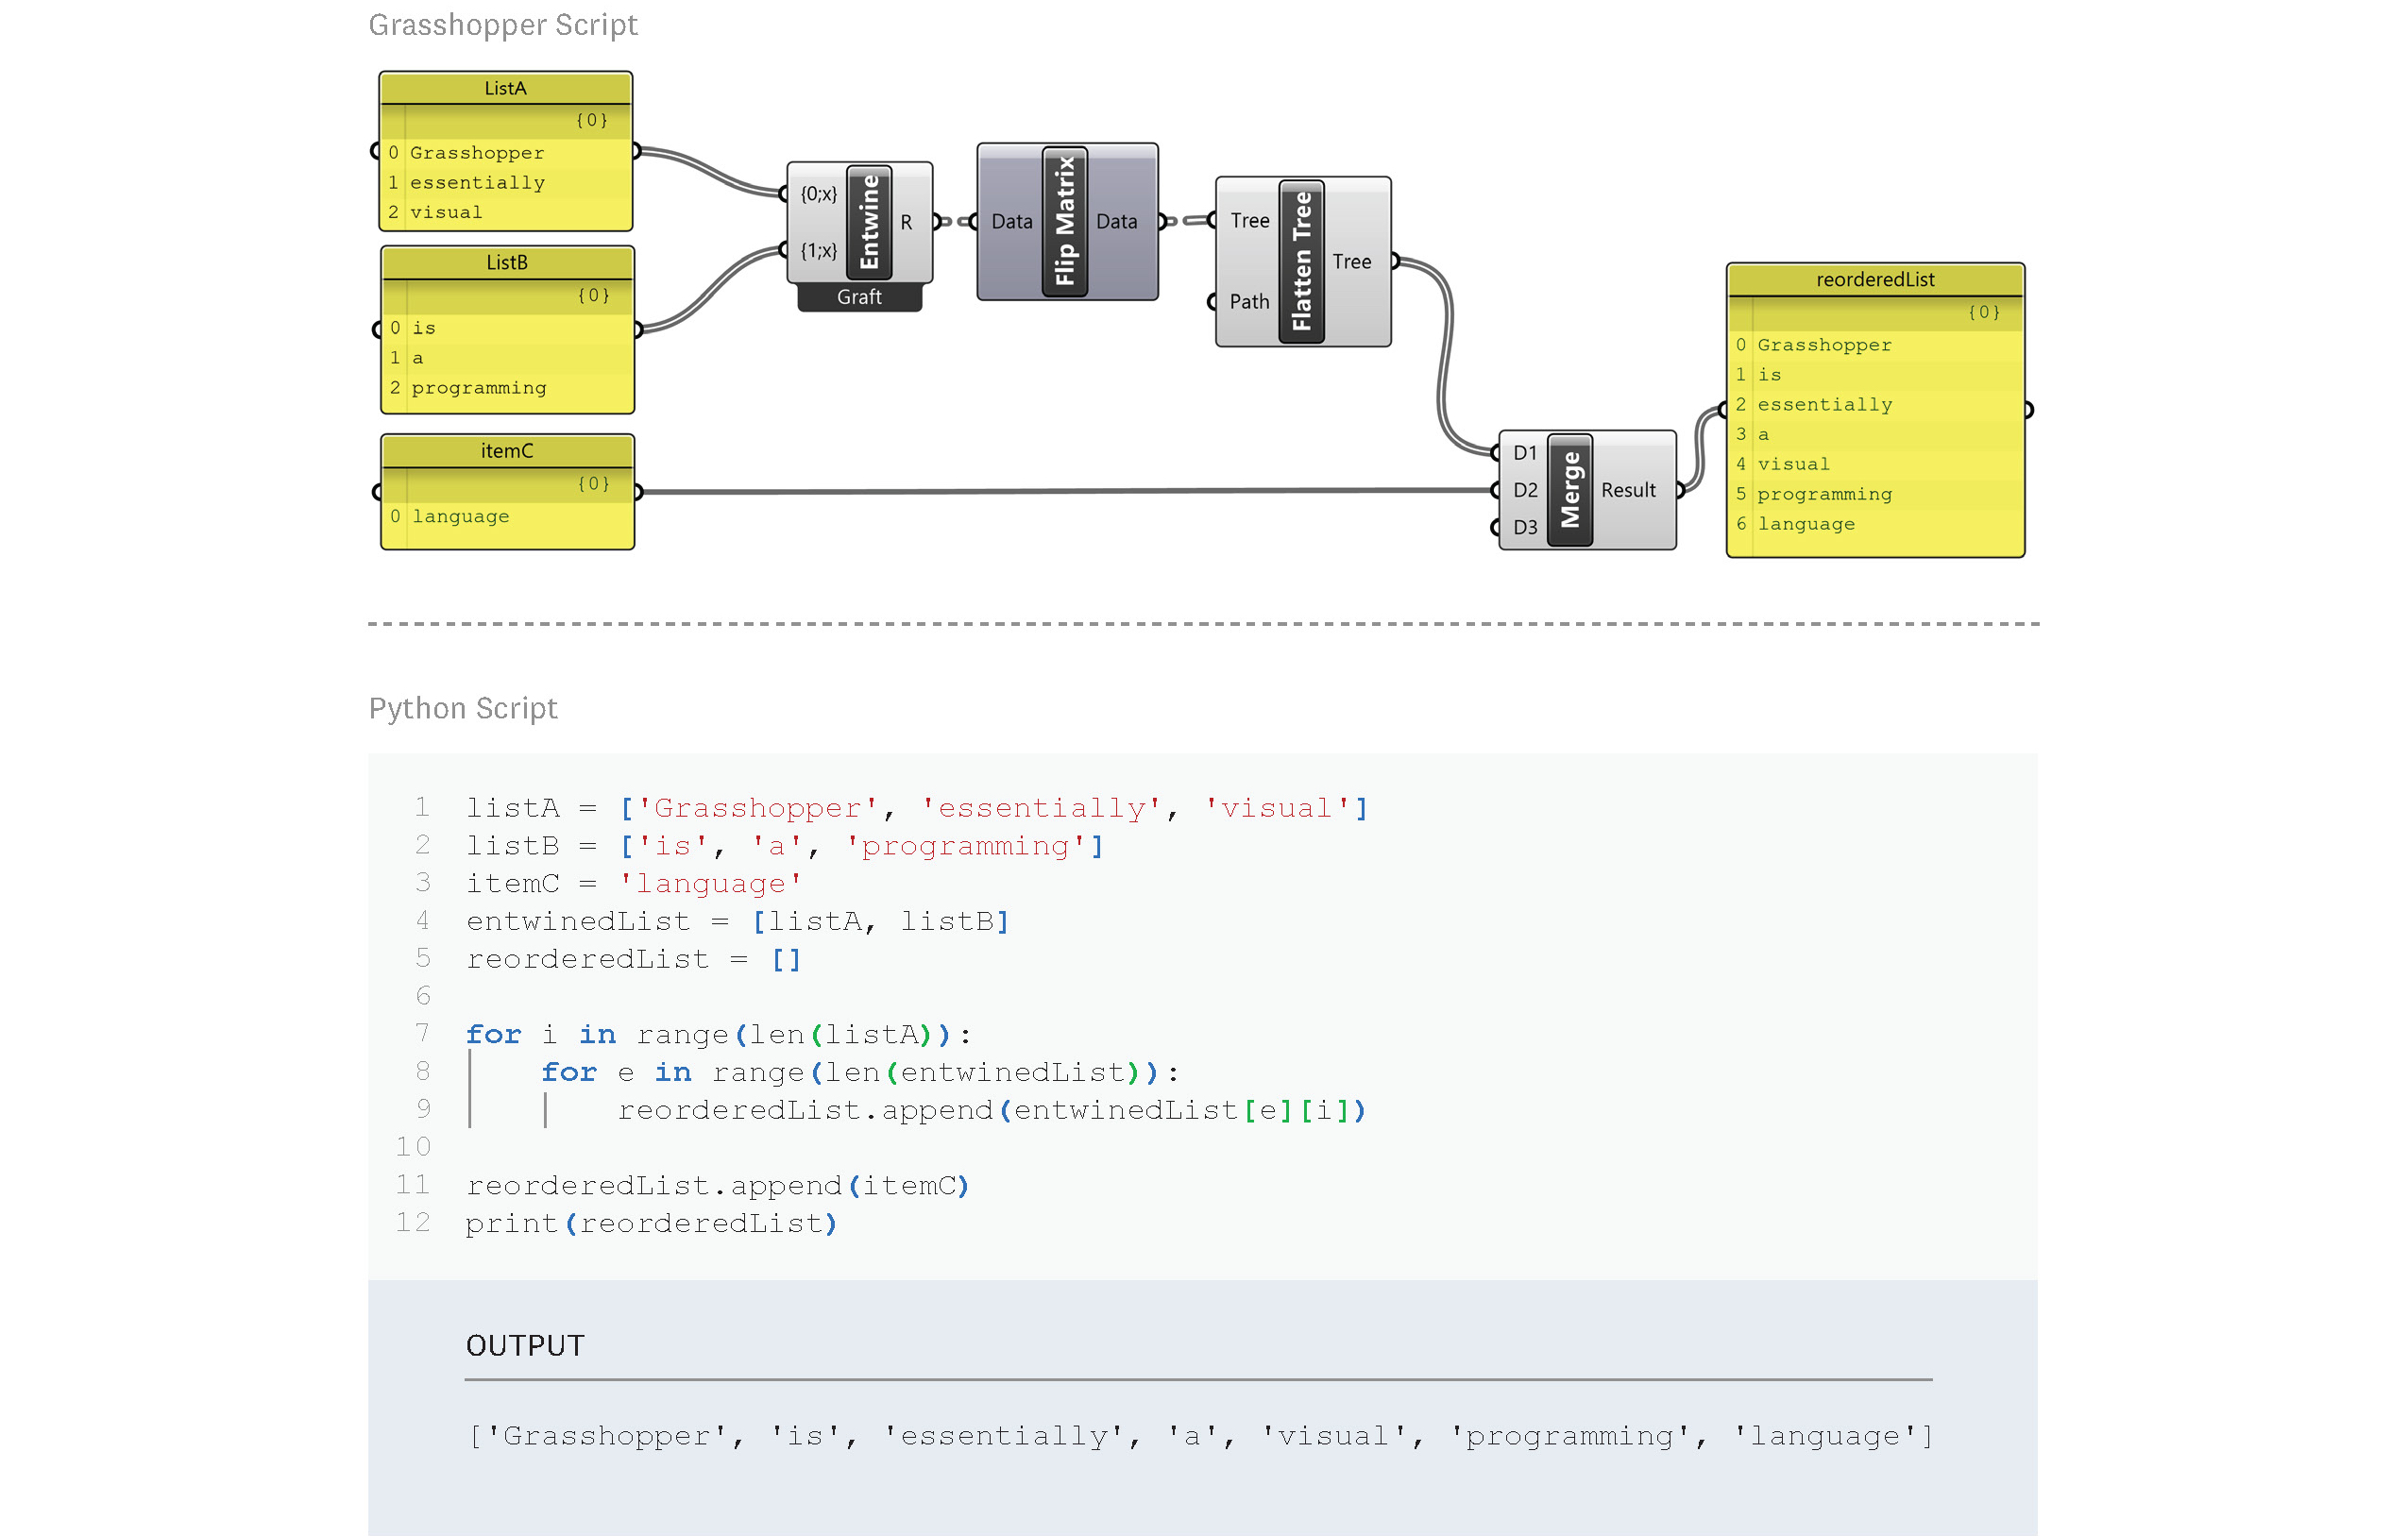
Comparison of a Grasshopper script and a Python script—Grasshopper is essentially a visual programming language