Climate Charts
2022 | Buro Happold
I am in the process of developing a JavaScript prototype of editable climate charts here
In my role at Buro Happold, I have gained programming experience by writing scripts that help engineers create their own graphics. Most notably, I helped to automate our climate charts. Using a program called “Grasshopper,” I wrote a script that reads a typical climate file and outputs a set of charts describing temperature, humidity, wind, and other conditions. My challenge was not just to determine the visual appearance of the output, but to maximize the usability of the script. I balanced automatic features (such as calculating the best-fit range of round numbers) with custom features (such as providing the option to posterize or blend colors), so that engineers could quickly output charts for any climate in the world but also make detailed adjustments when necessary. While I enjoyed designing how the charts should look, designing how they should work and executing that design in Grasshopper was one of the most rewarding experiences of my career—and inspired me to pursue advanced study of software development at Boston University.
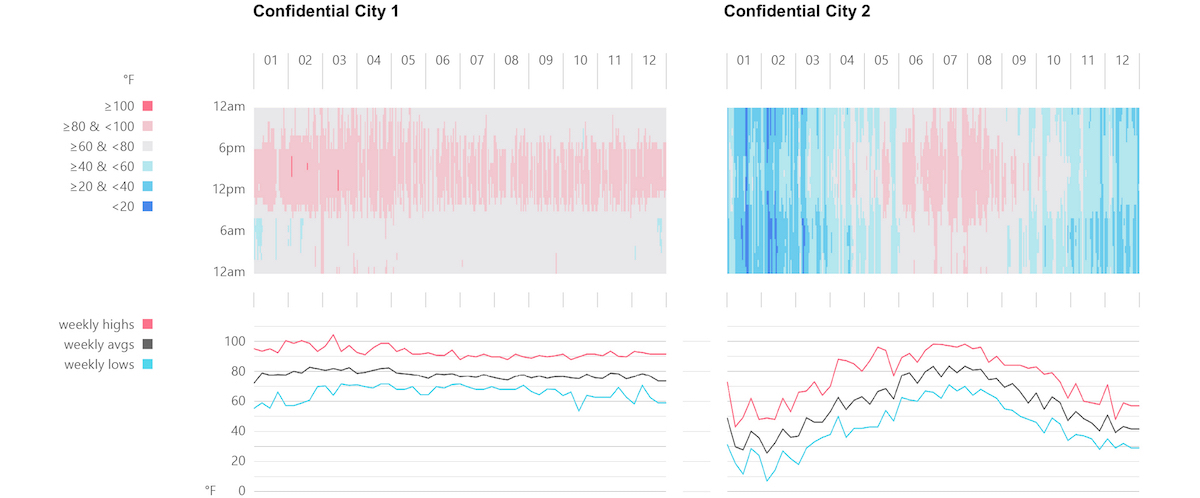
Dry bulb temperature
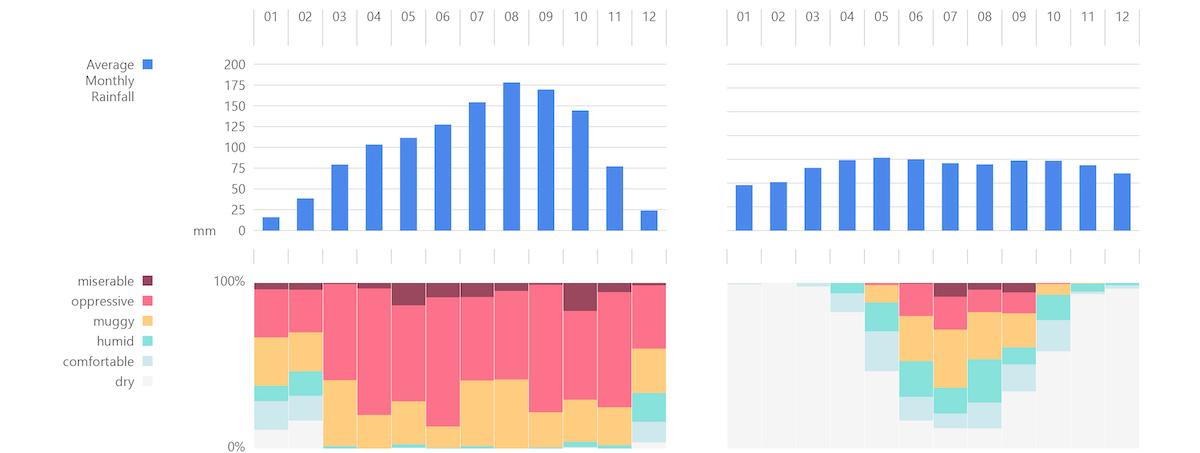
Rainfall & humidity
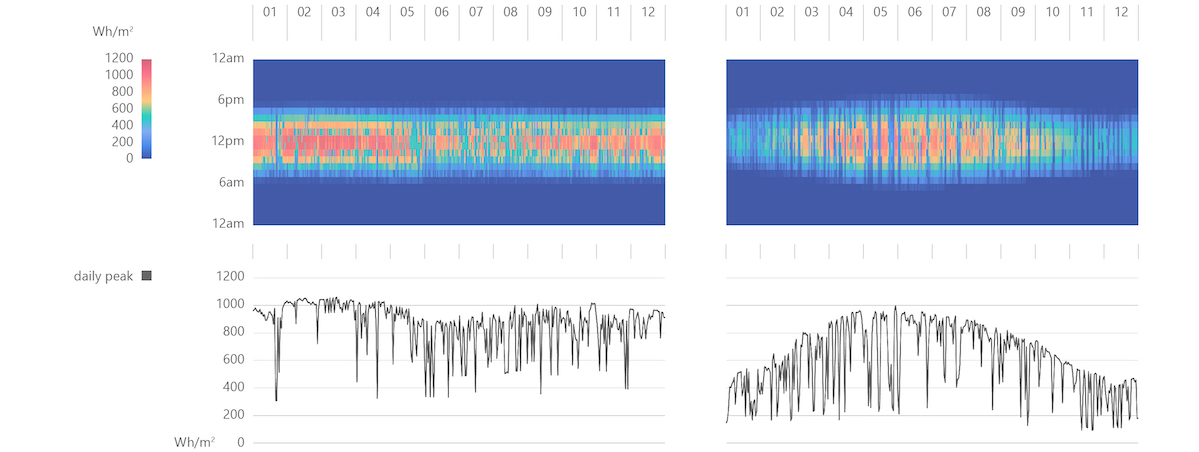
Solar insolation
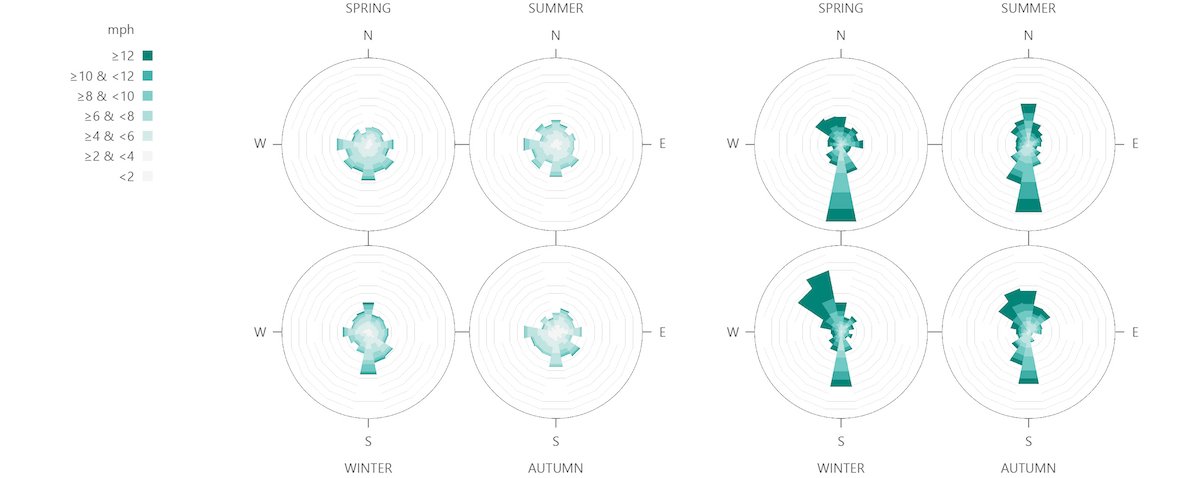
Wind
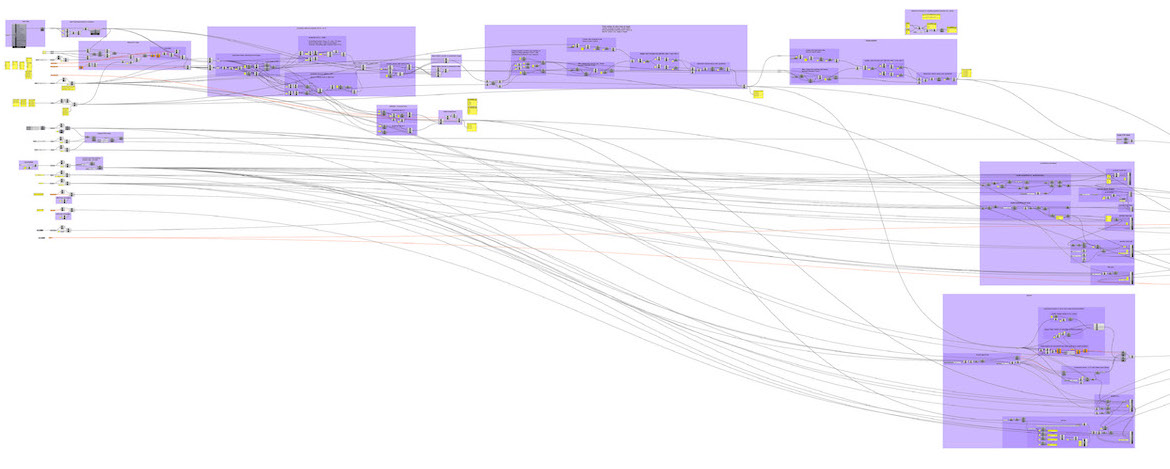
Grasshopper script overview
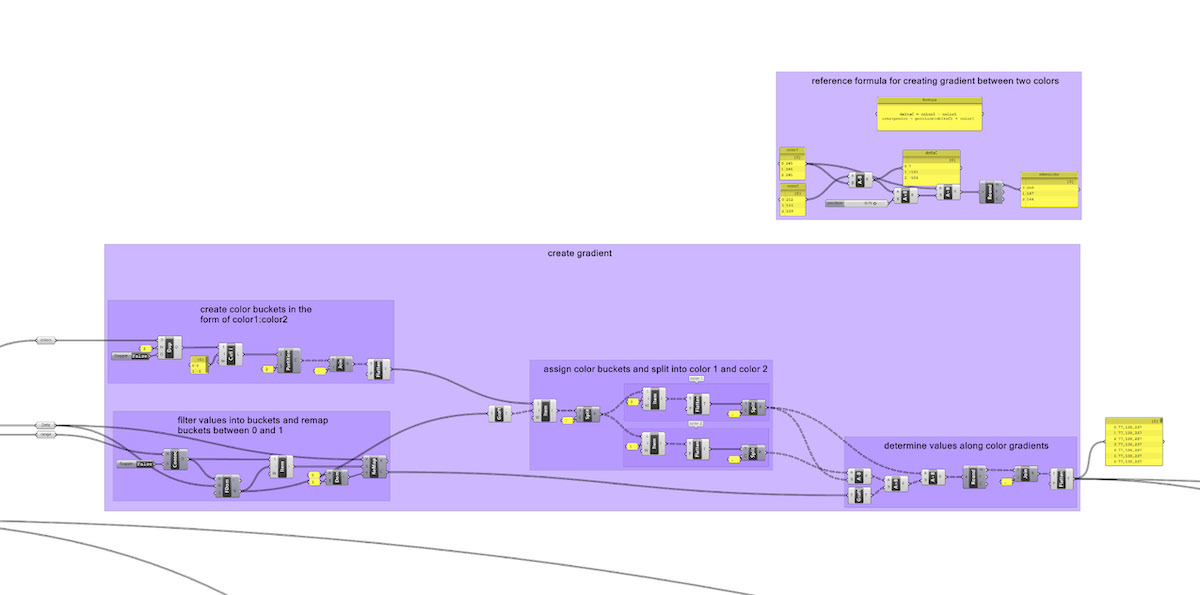
Grasshopper script zoomed in—method for interpolating between RGB values
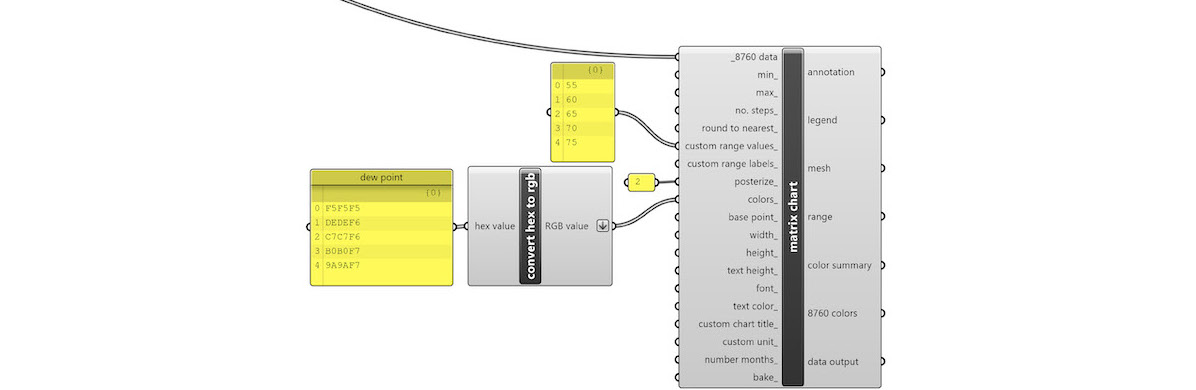
Packaged Grasshopper script, showing inputs and outputs
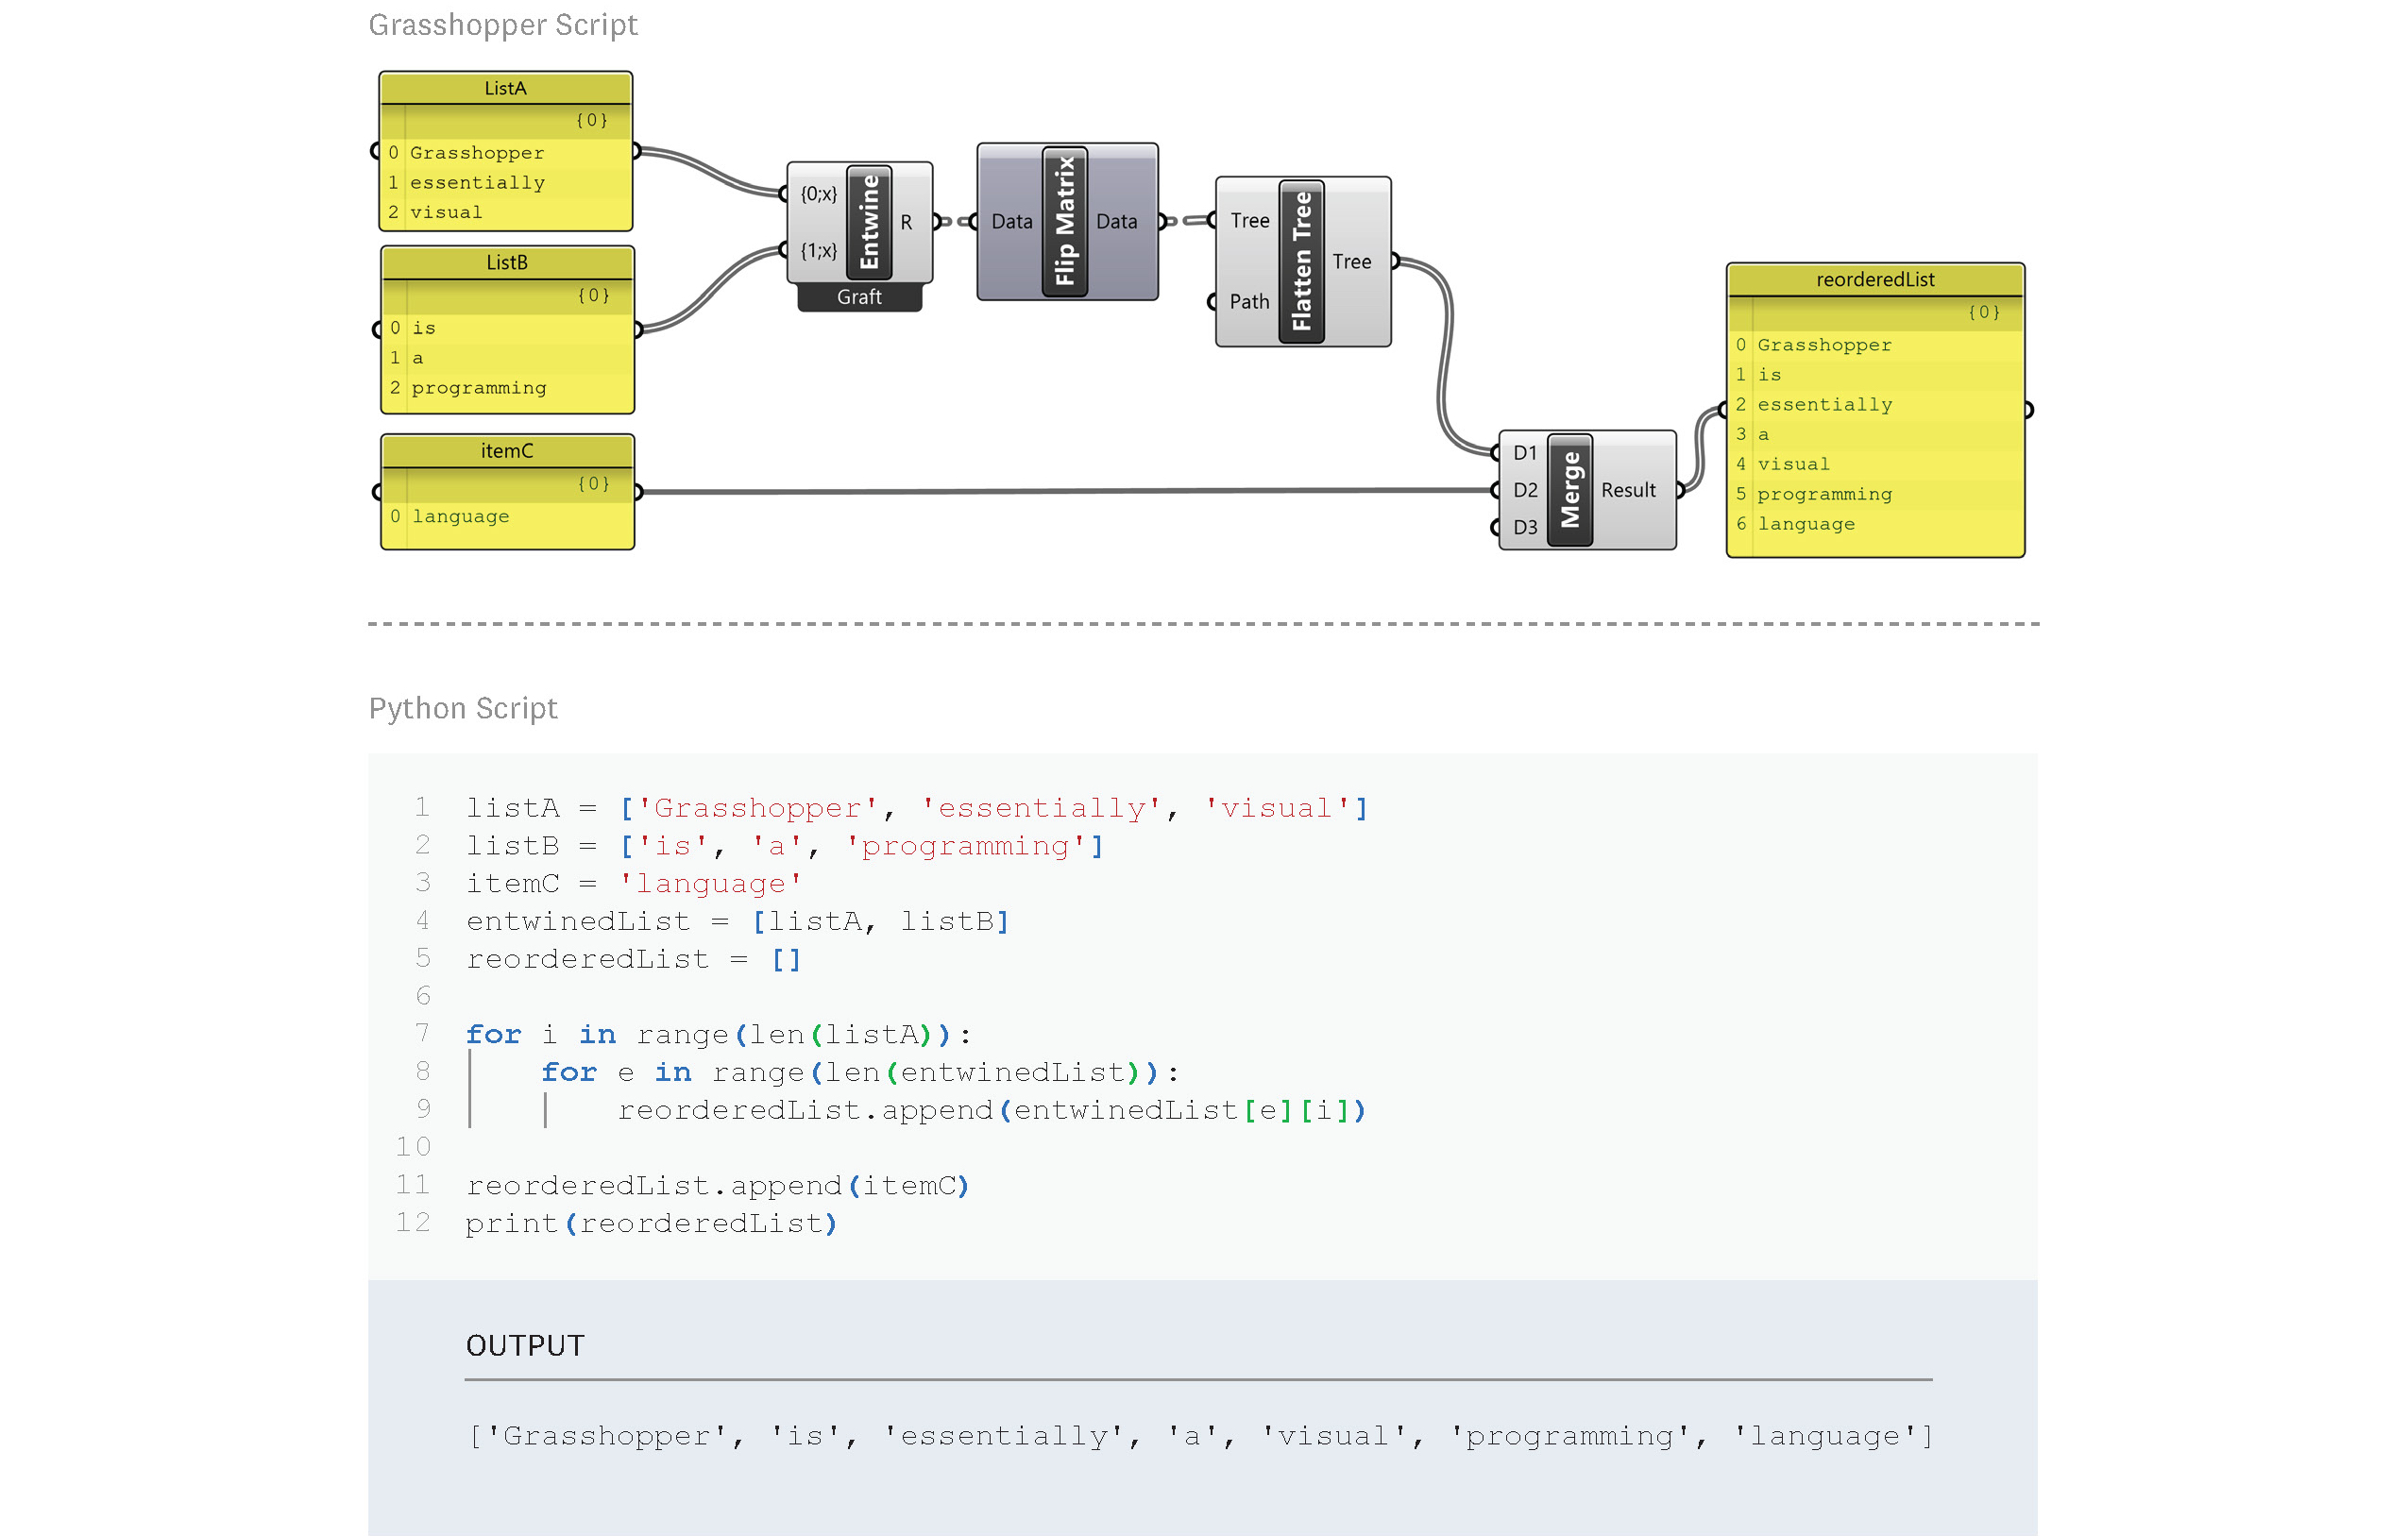
Comparison of a Grasshopper script and a Python script—Grasshopper is essentially a visual programming language